
Navigation Planning
Introduction
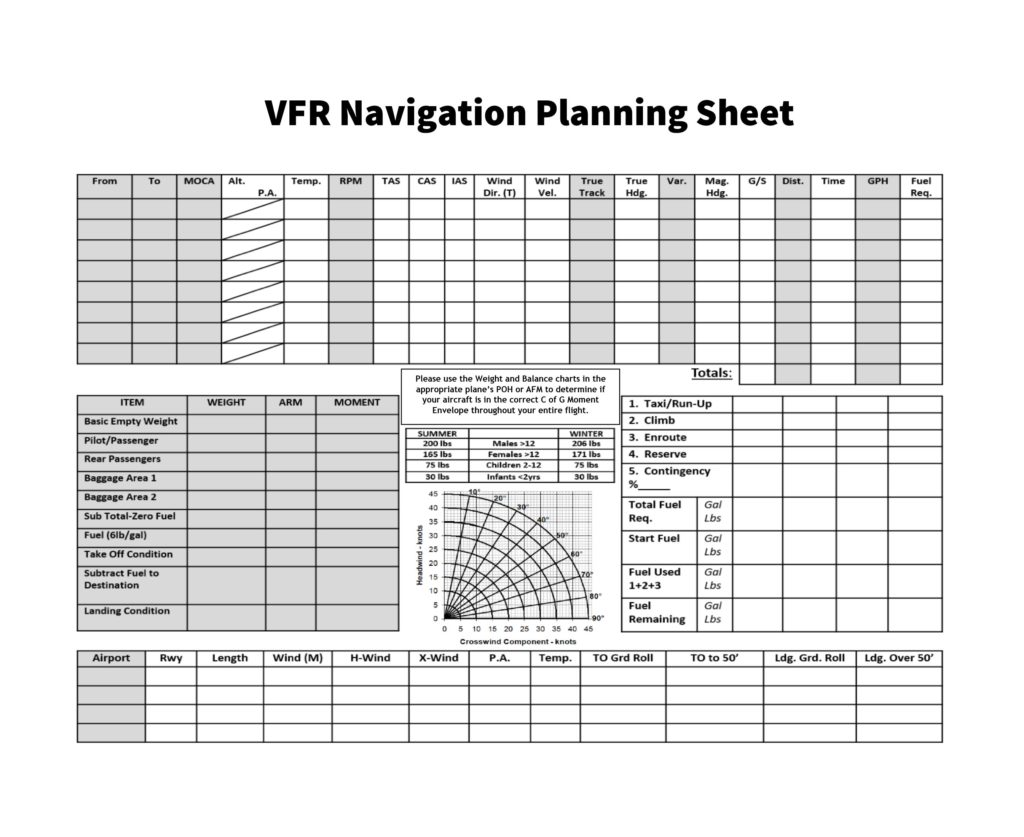
There are many versions of VFR Navigation Planning Sheets, commonly known as Nav Logs, but they all have similar information on them. The one we’ll be using is very thorough and includes a weight and balance section. It was found on the Spectrum Airways website. Navigation Planning sheets are a way to bring all information needed to plan and execute a flight, onto one, easy to read, page. You will use your planning sheet with your VNC Chart(s) to plan and fly your cross country flights.
We’ve planned a flight from Hamilton to London, Ontario, and back, in order to show you step-by-step how to fill one out. In this lesson, we will fill out the top section of this flight planning form.
Pre-Plan
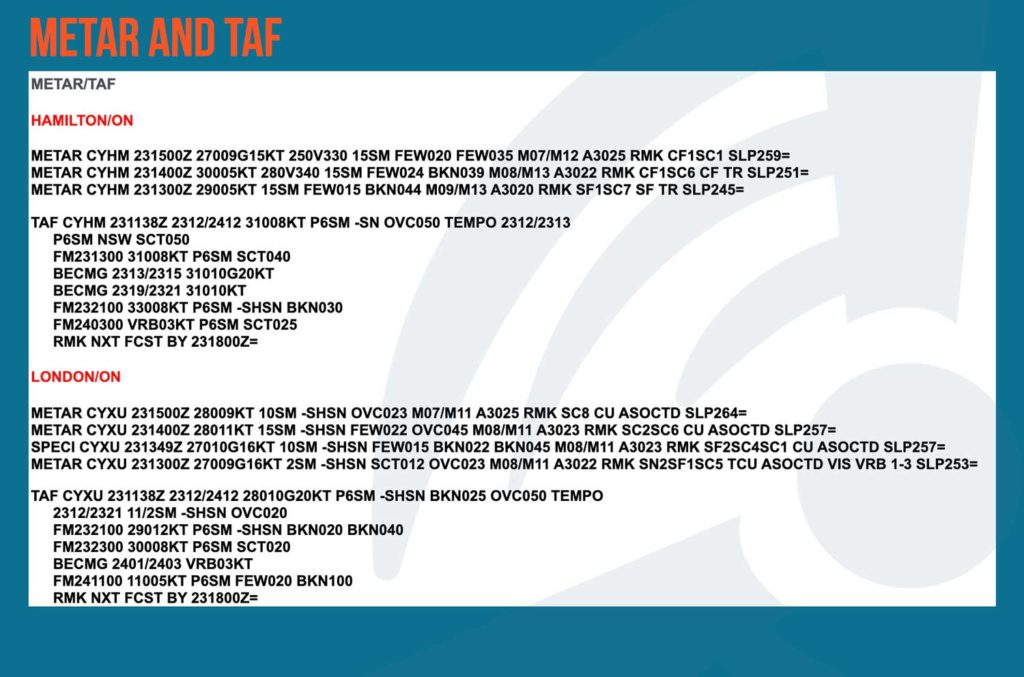
Before making a plan, check the weather to see if it’s going to cooperate for you. Check the METAR and TAF for all airports you intend to depart from and arrive at. Check the GFAs, for clouds and weather, as well as freezing level, turbulence, and icing. You can find all of these weather forecast aids on the NavCanada website. Call your local Flight Information Center for a weather briefing. They are trained professionals and can give you the most up to date weather forecast for the day. Check the NOTAMS for the airports you’re flying to, as well as along your route, to make sure there are no restrictions. Use this helpful guide if you have trouble decoding them. The FIC can also give you this information verbally. If there’s no inclement weather or flight impacting NOTAMS, start your plan.
CYHM to CYXU
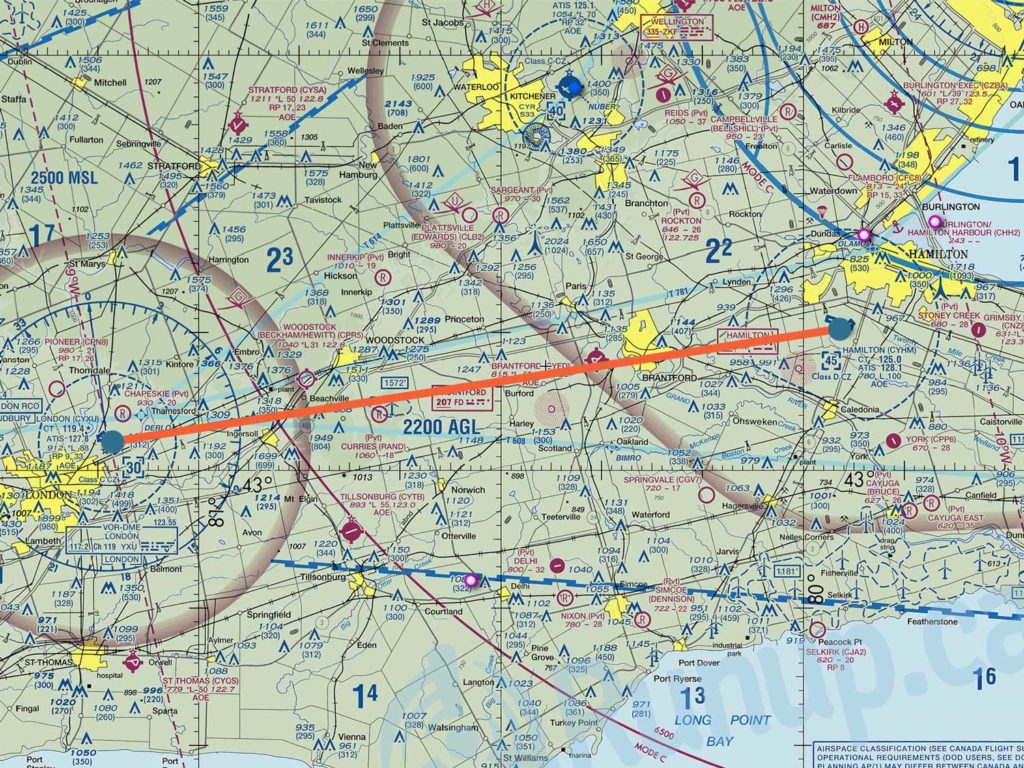
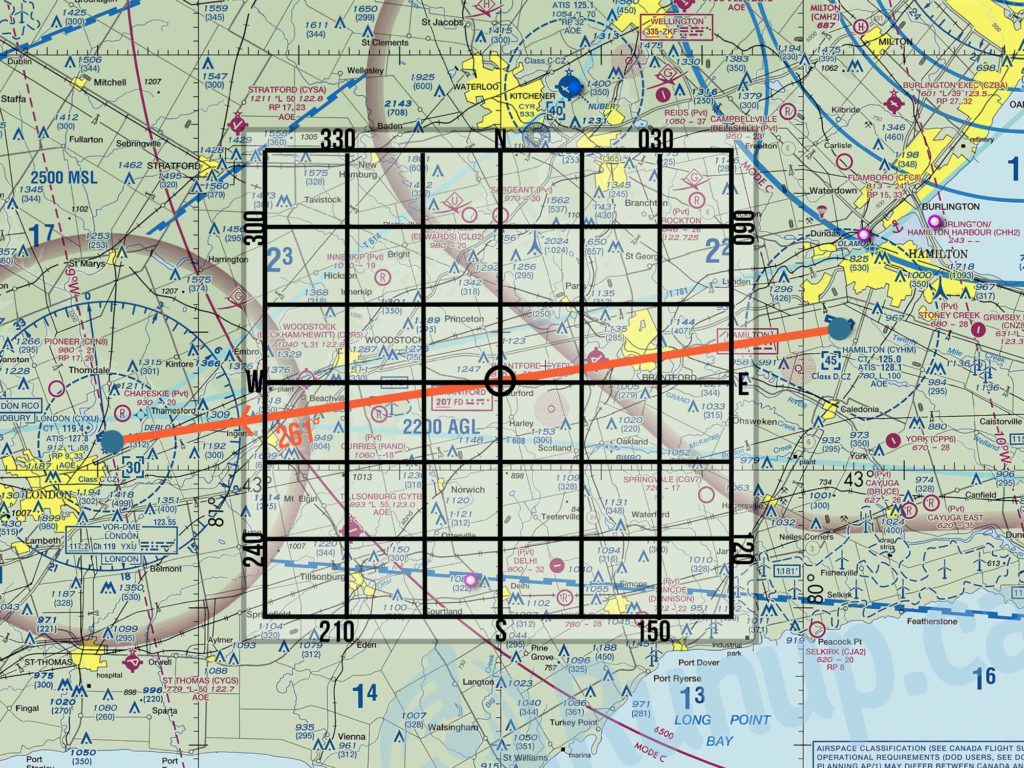
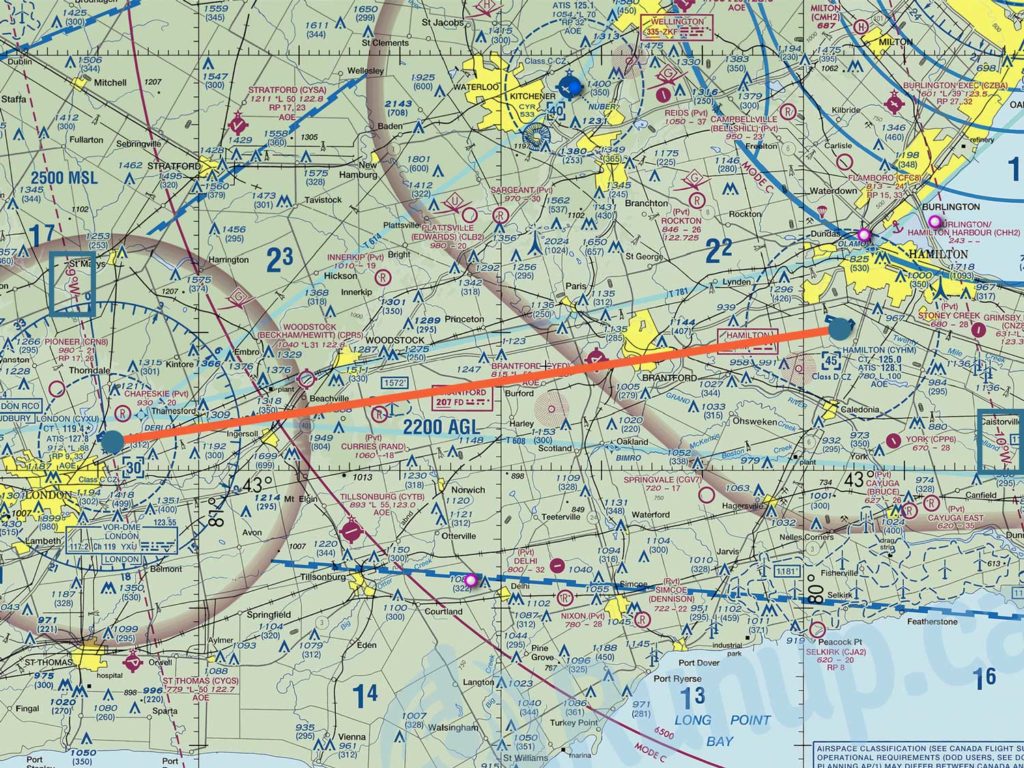
Draw a line on your VNC chart between your two airports with a pencil and your ICAO ruler. Make it prominent enough that you’ll be able to read it easily in the plane, but not thick enough that it covers important landmarks.
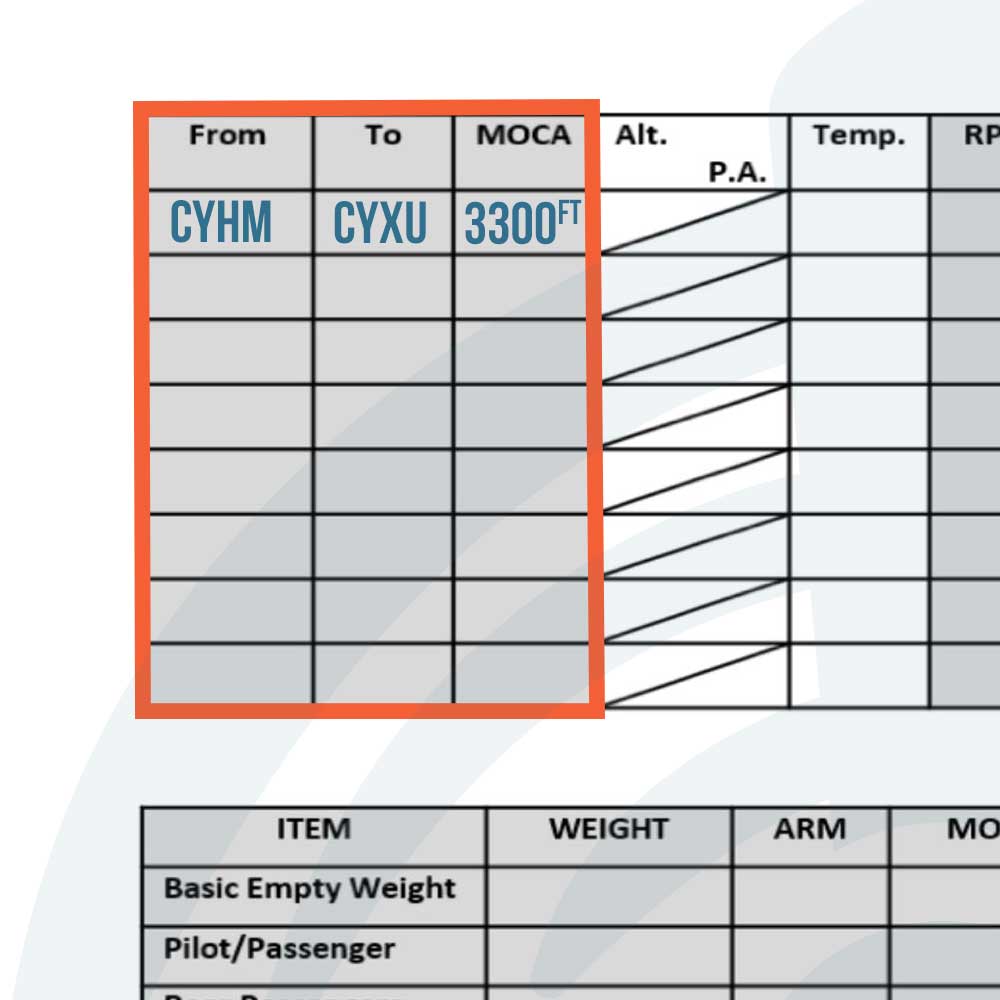
MOCA / MEF
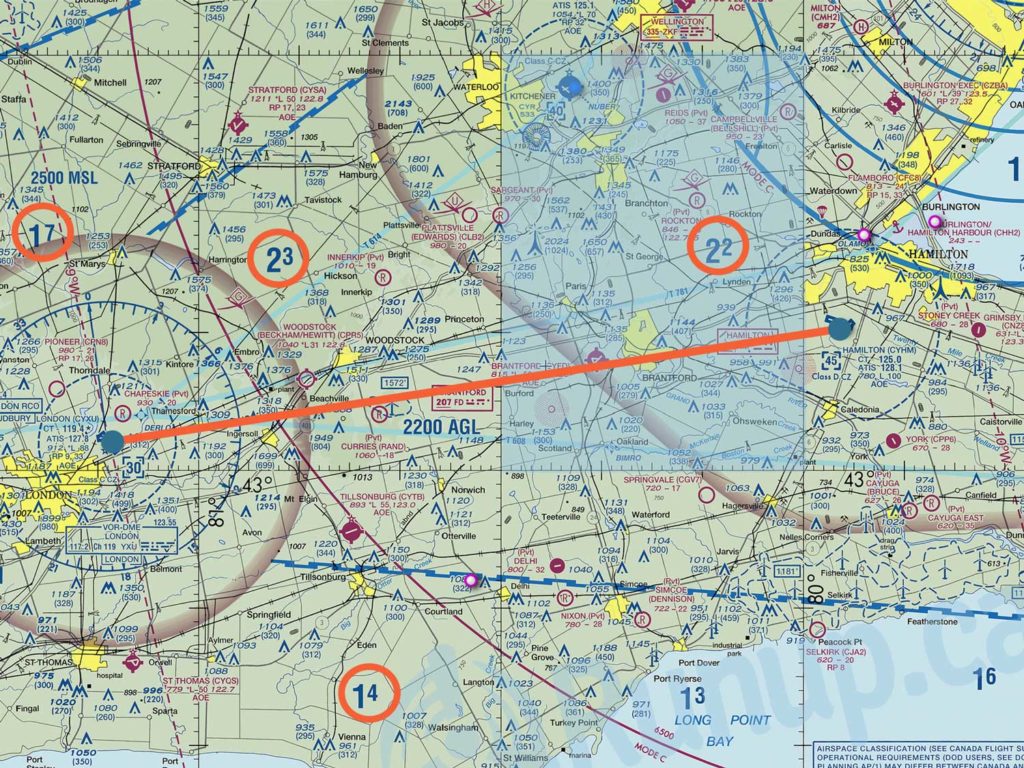
MOCA is a term usually used in IFR flying. To get the MOCA for this flight, use the MEF values. They are large numbers, one per grid square on the VNC, and they indicate the elevation of the highest point, within those grid borders. It is recommended to fly 1000ft above this height. If it’s very cold, you could consider flying 2000 feet above it just to be safe. The highest obstacle we could possibly fly over on our route is 2300ft AGL. Which means our MOCA for this flight will be 3300ft AGL.
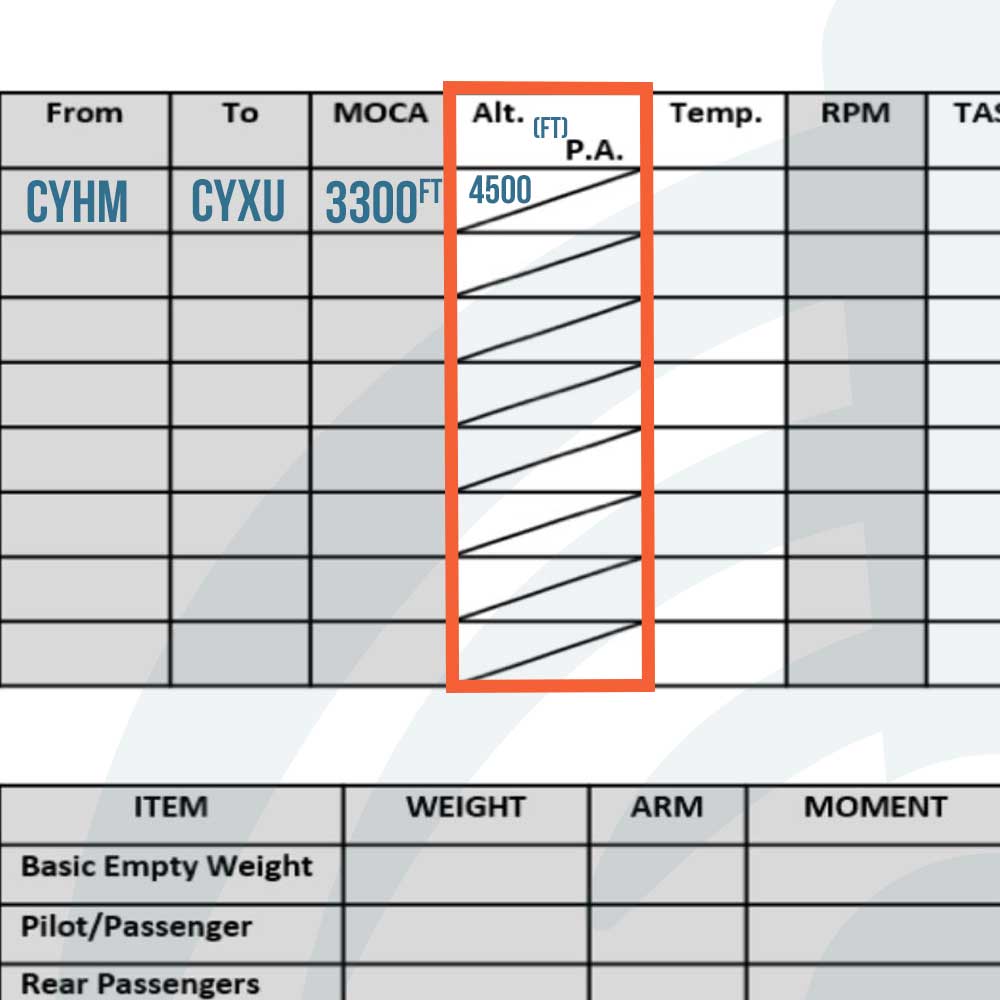
Alt. (Altitude)
Choose an altitude for your trip. Keep the MEF in mind, along with ceiling height, restricted airspace, and large bodies of water. Check the METAR, TAF, and the GFA on NavCanada. If you’re flying a westerly heading, the altitude should be even thousands(4000, 6000, etc) + 500ft. If you’re flying east, you should fly at an odd thousand(3000, 5000, etc) + 500ft. These height rules keep vertical separation between planes and help stop collisions from happening. Since we are travelling in a westerly direction and our MOCA is 3300ft AGL, we would fly at 4500ft for the first leg, and 5500ft on the way back.
P.A. (Pressure altitude, or PAlt)
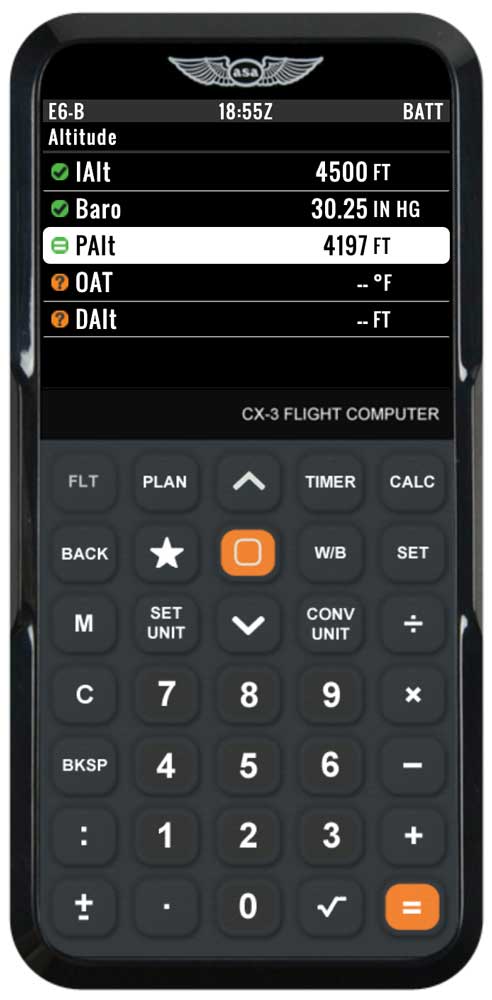
Using your CX-3 Flight Computer, you will get this number in the FLT button > Altitude section. You’ll need to enter:
IAlt – the indicated altitude you’ve chosen to fly at: 4500ft
Baro – the Altimeter setting found on the METAR (reads A3025): 30.25 in Hg
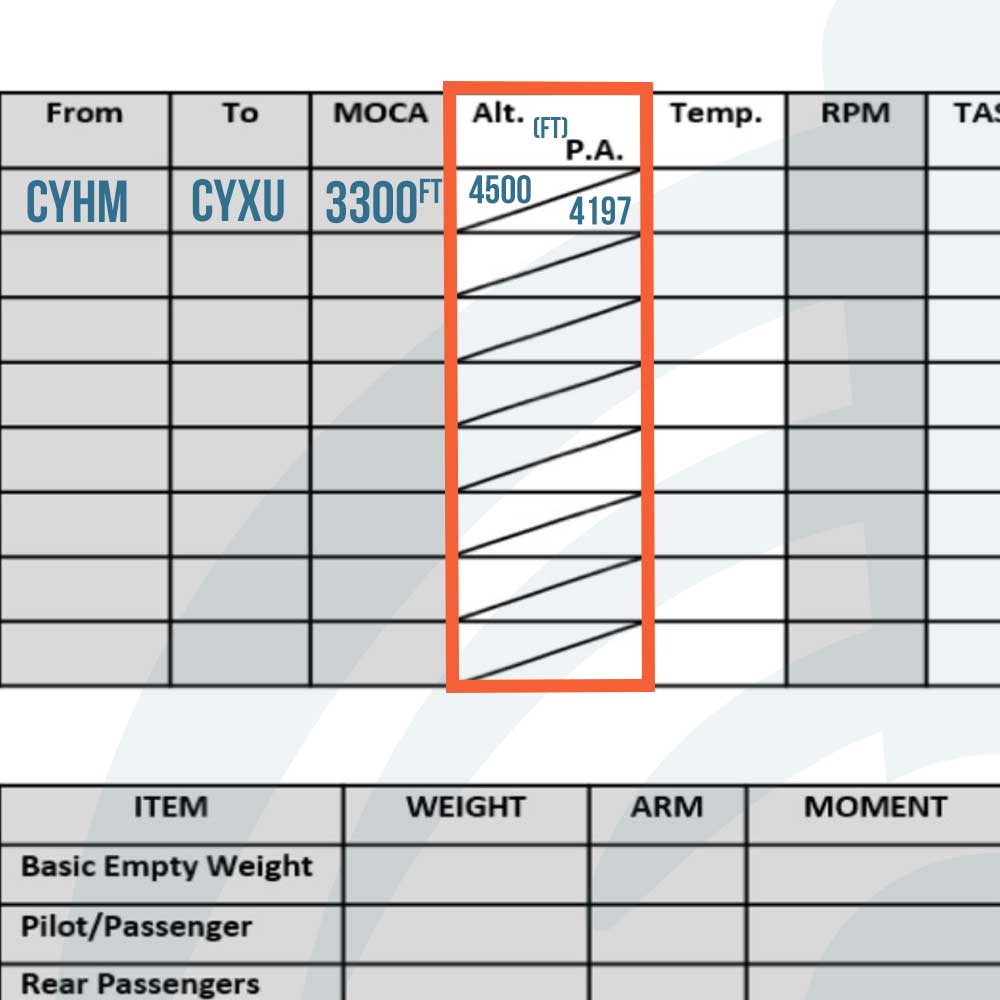
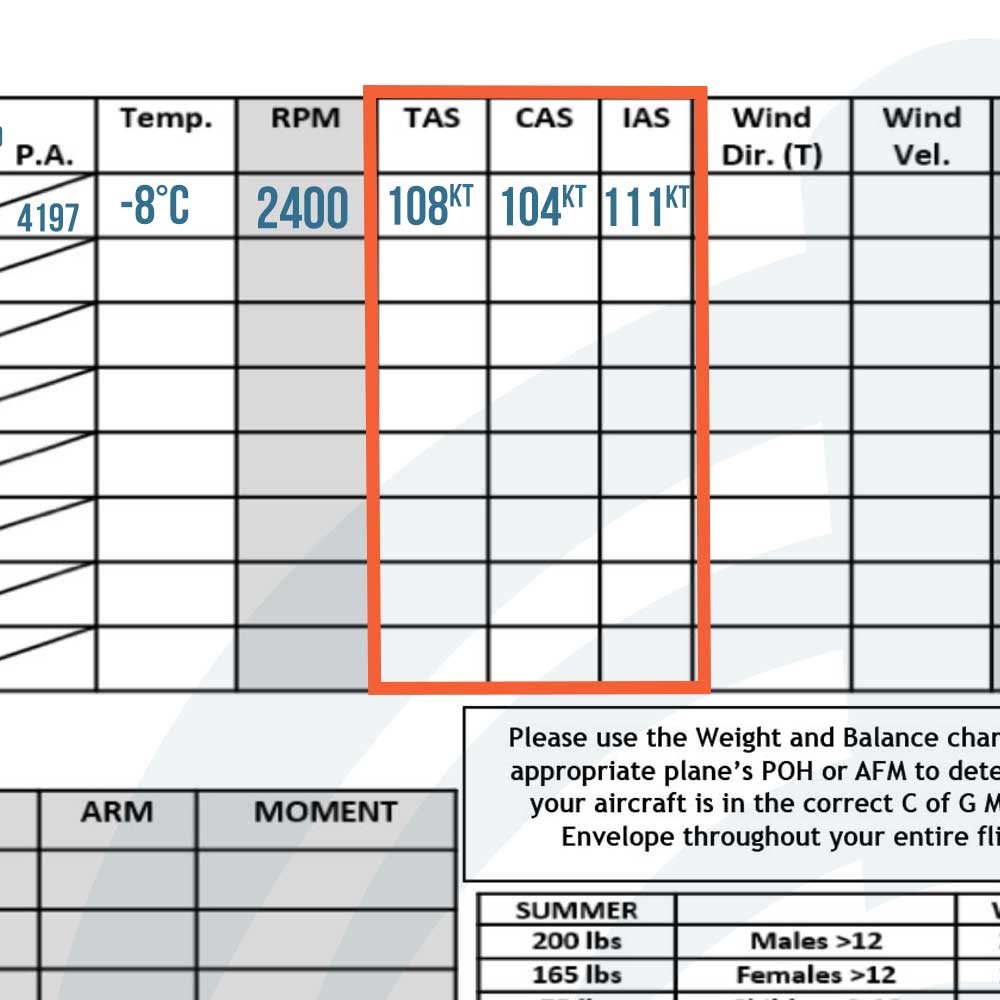
P.A. = 4197ft
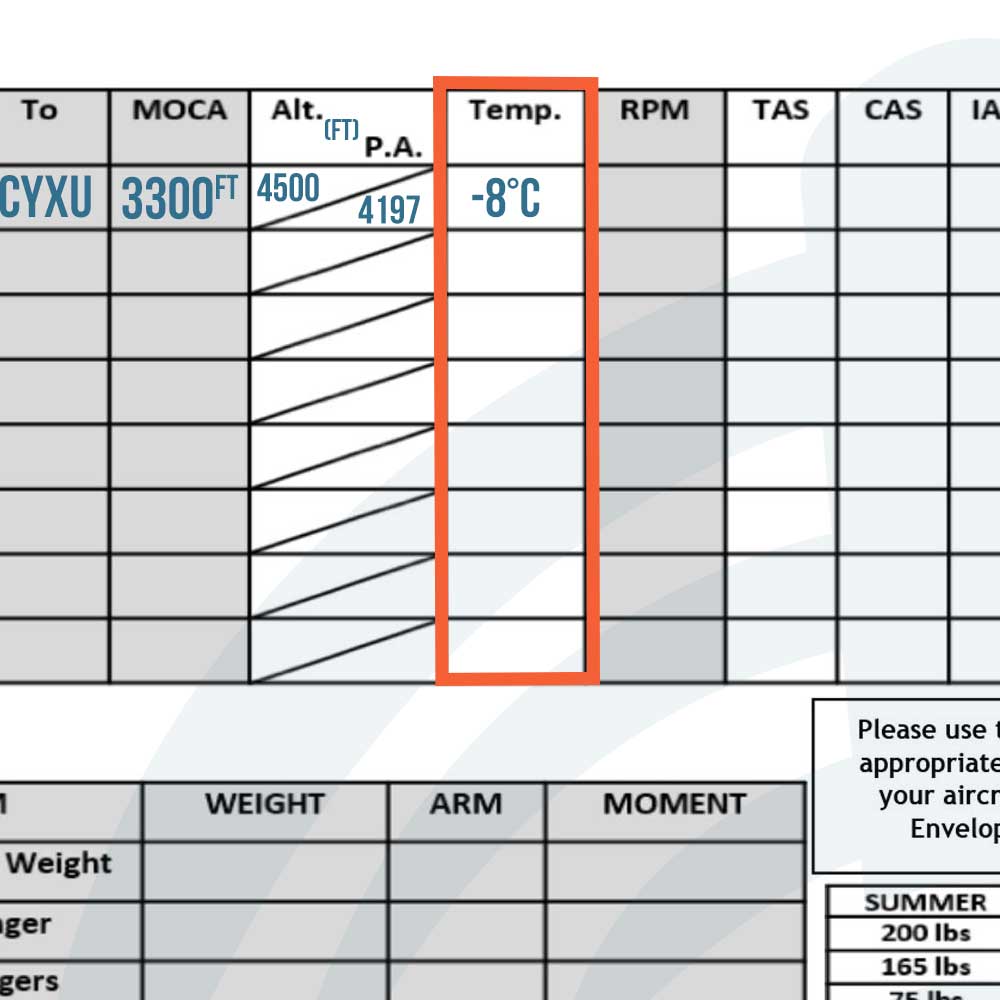
Temperature
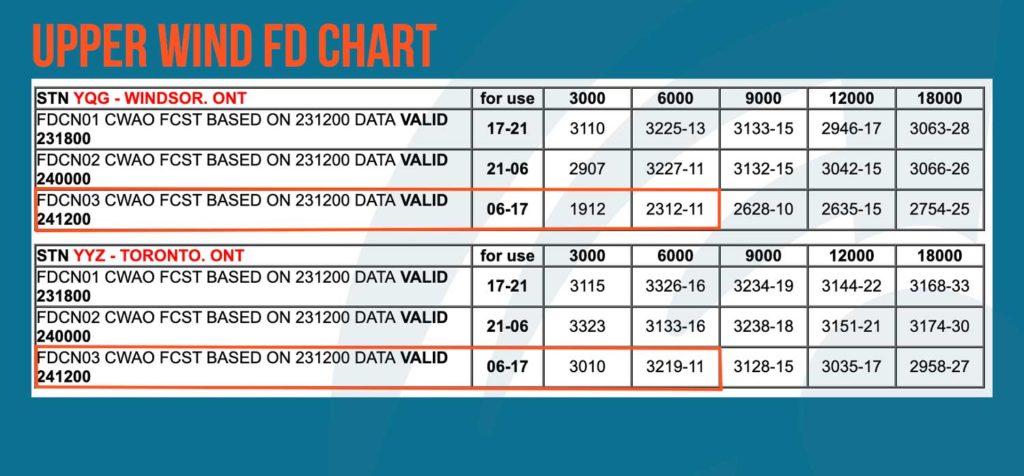
Use the Upper Wind FD charts found on the NavCanada AWWS website.
Since Hamilton and London don’t have their own charts, we can use the averages between Toronto and Windsor.
We are using the the “06-17” section under “for use,” as we’re departing at 1530Z.
The information is broken up into altitudes of 3000ft, 6000ft, 9000ft, etc. Take the average between 3000ft and 6000ft because we are flying at 4500ft. The 3000ft column doesn’t actually have a temperature listed, but if we assume the temperature rises 2°C every 1000ft down, and it’s -11°C at 6000ft, we get -8°C at 4500ft.
Upper Wind FD Charts can be confusing so, reference this user guide to help you decode them. Refer to it if you ever have values you don’t understand.
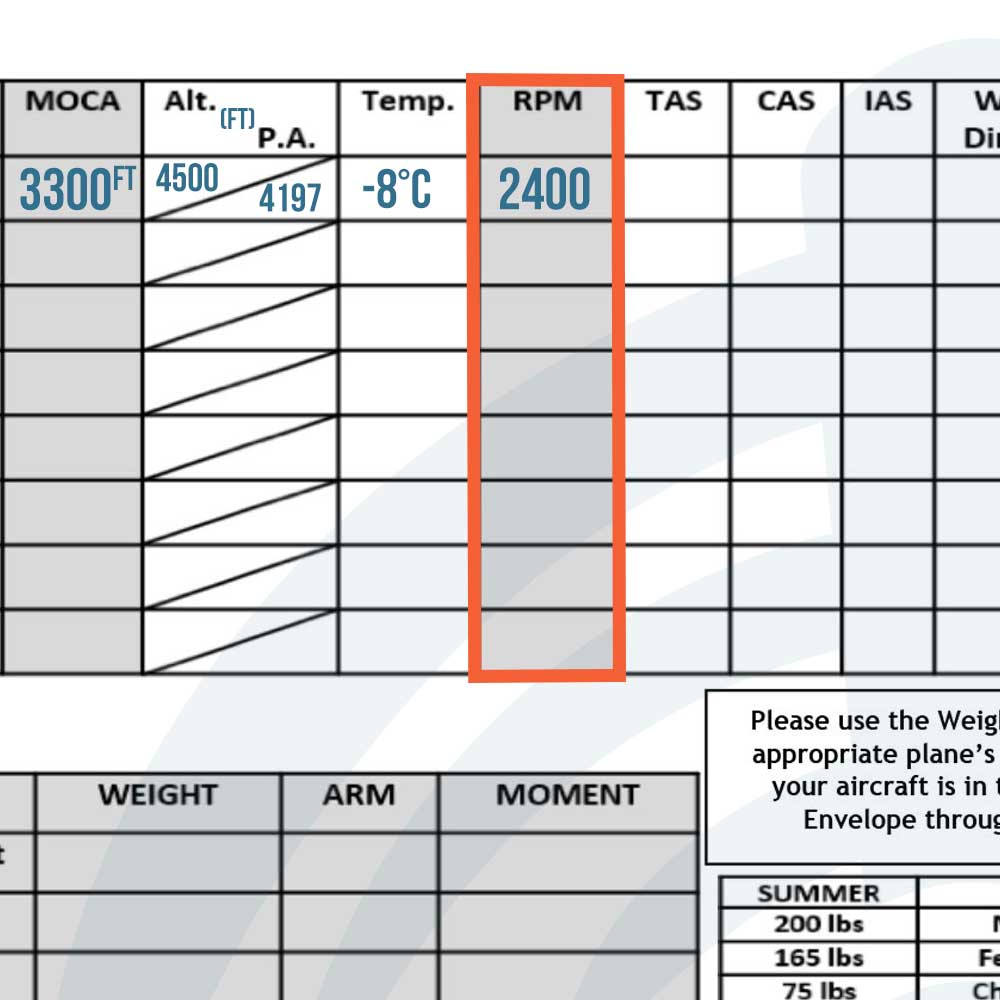
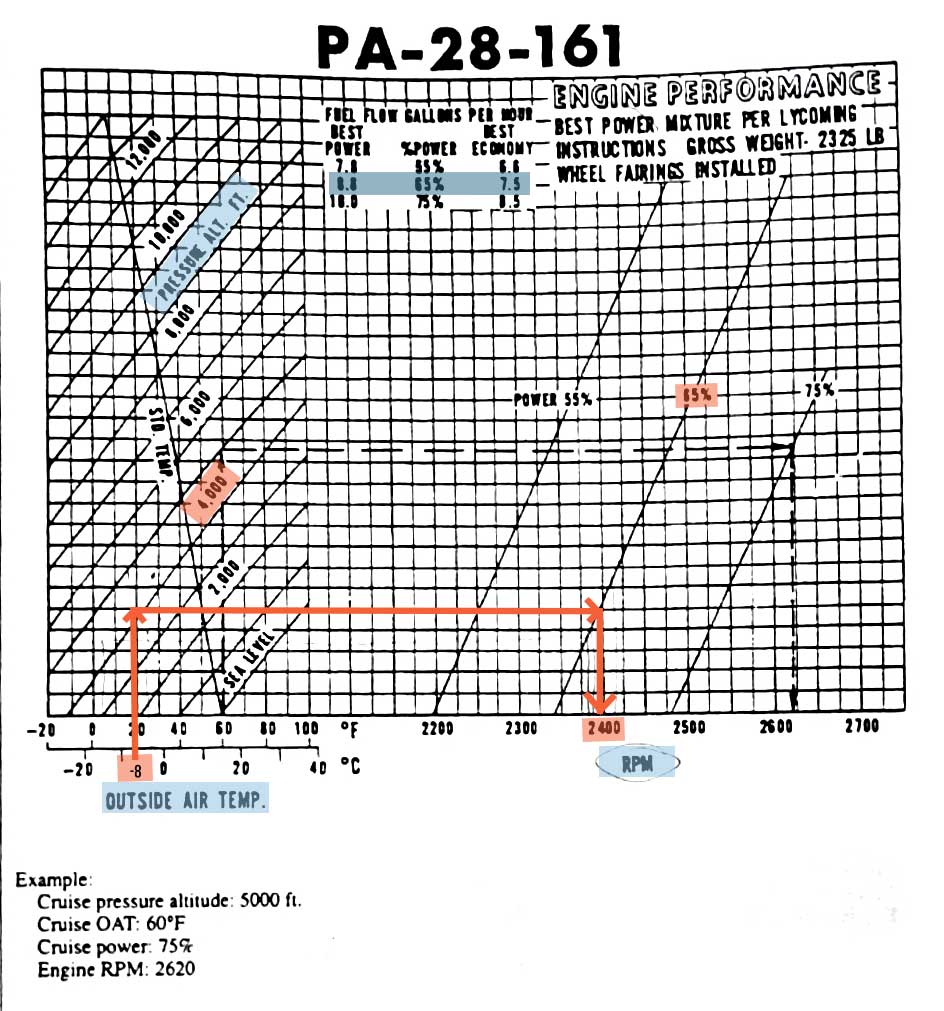
RPM
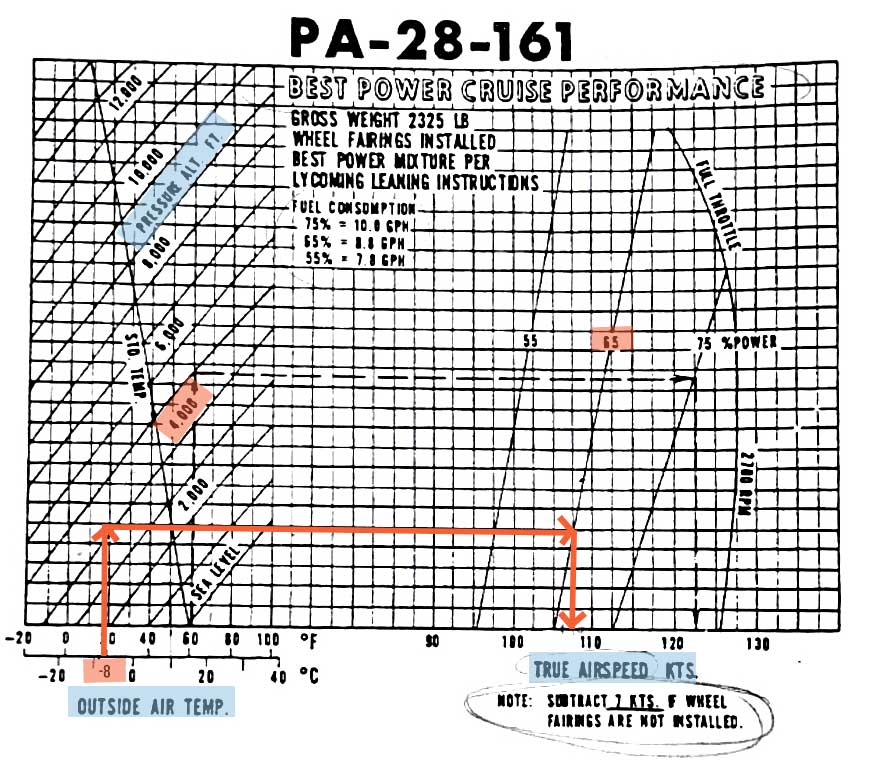
Use your POH chart to fill in this box – it may look different than this particular one but will have similar titles or require similar values to obtain the RPM setting. For this chart, we use the OAT, Pressure Altitude, and the cruise power setting we plan to fly at (65% power – burns 8.8gph) to find the correct RPM setting for best engine performance. The RPM setting we get with our values is just about 2400rpm.
TAS (True Airspeed)
Your true airspeed is found on the Best Power Cruise Performance chart in your POH. Similar to the Engine Performance Chart for RPM setting, you’ll need the OAT, PAlt, and best power rate (65%).
TAS= ~108kt
CAS (Calibrated Airspeed)
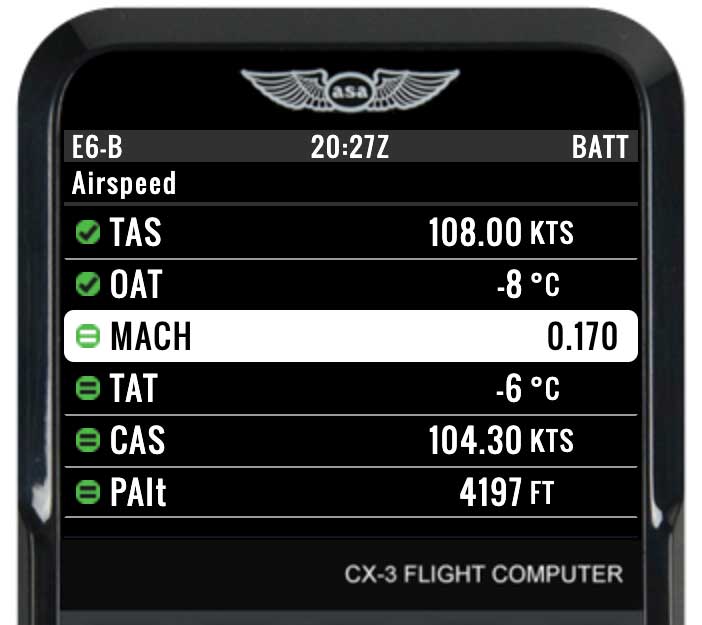
This value is calculated on your CX-3 under FLT > Airspeed.
You’ll need to enter TAS, OAT, and PAlt (Pressure Altitude).
CAS= 104kt
IAS (Indicated Airspeed)
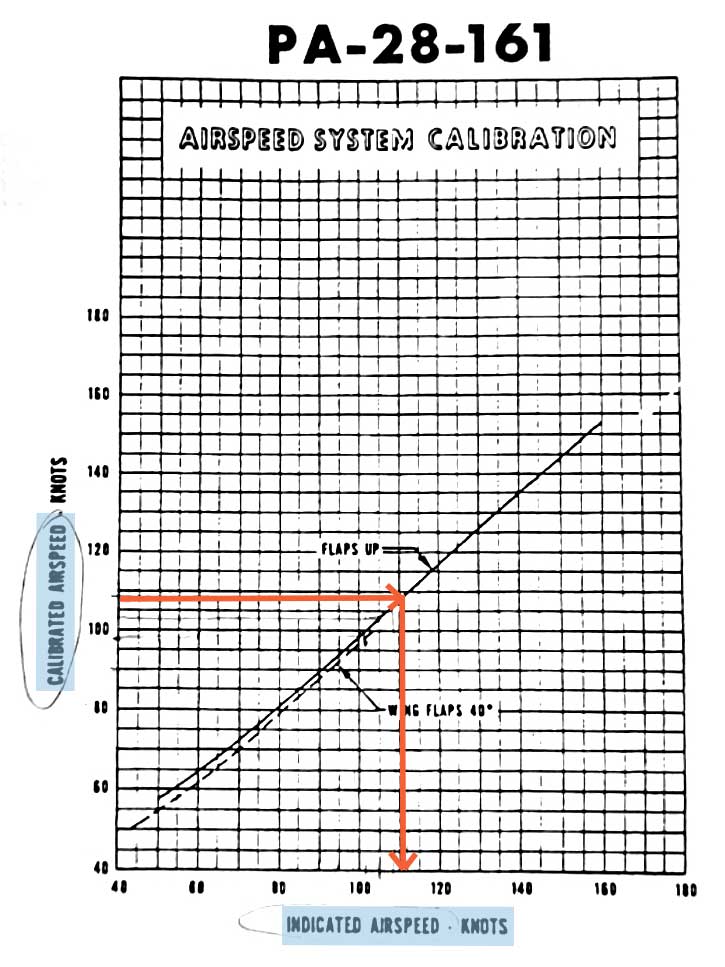
Use the Airspeed System Calibration chart in your POH. You’ll need the CAS (as seen above, 104kt) to figure out the IAS.
IAS= ~111kt
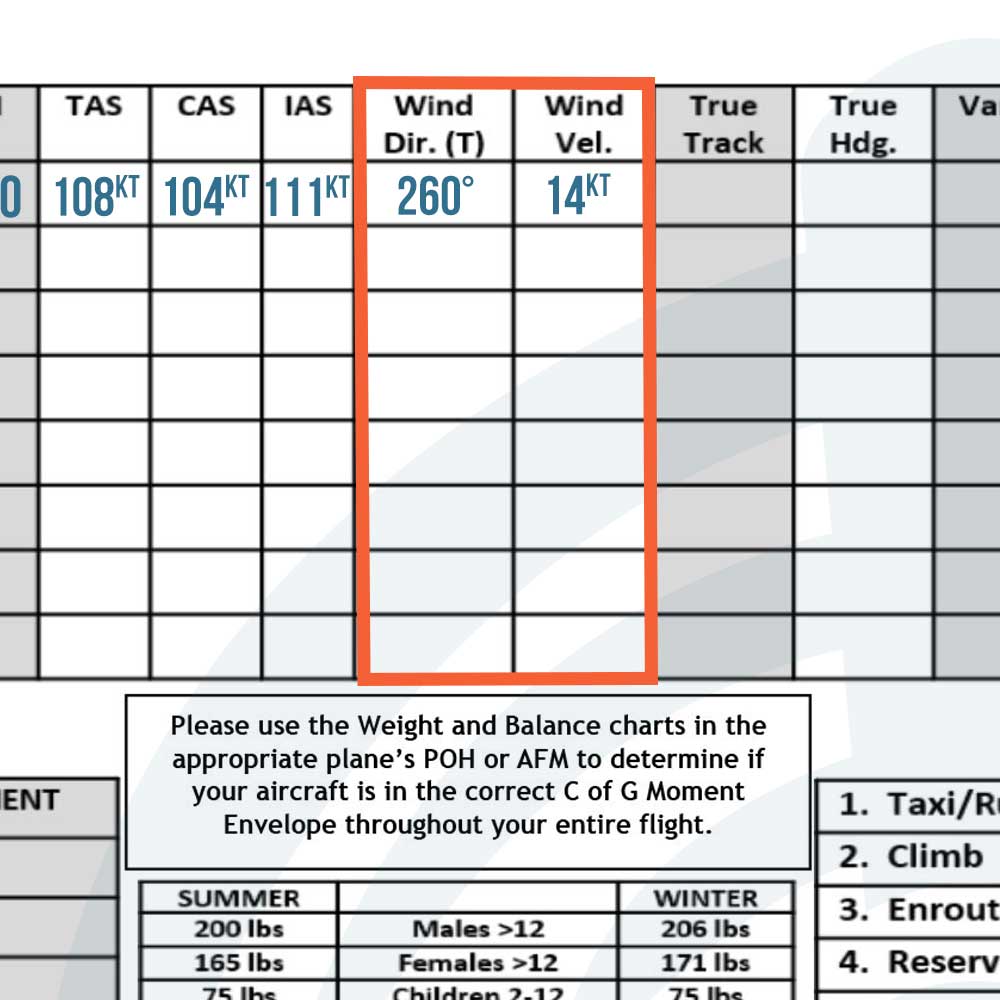
Wind Direction (T) & Wind Velocity
Use the Nav Canada Upper Wind FD charts again and take the average wind direction and velocity between Toronto and Windsor, for use 06-17, as well as the averages between 3000ft and 6000ft – since we’ll be flying at 4500ft.
Windsor avg is 210 true @ 12kt
Toronto avg is 310 true @ 15kt
Average between the two cities: 260 true @ 14kt
Once again, learn how to decode Upper Wind charts right here.
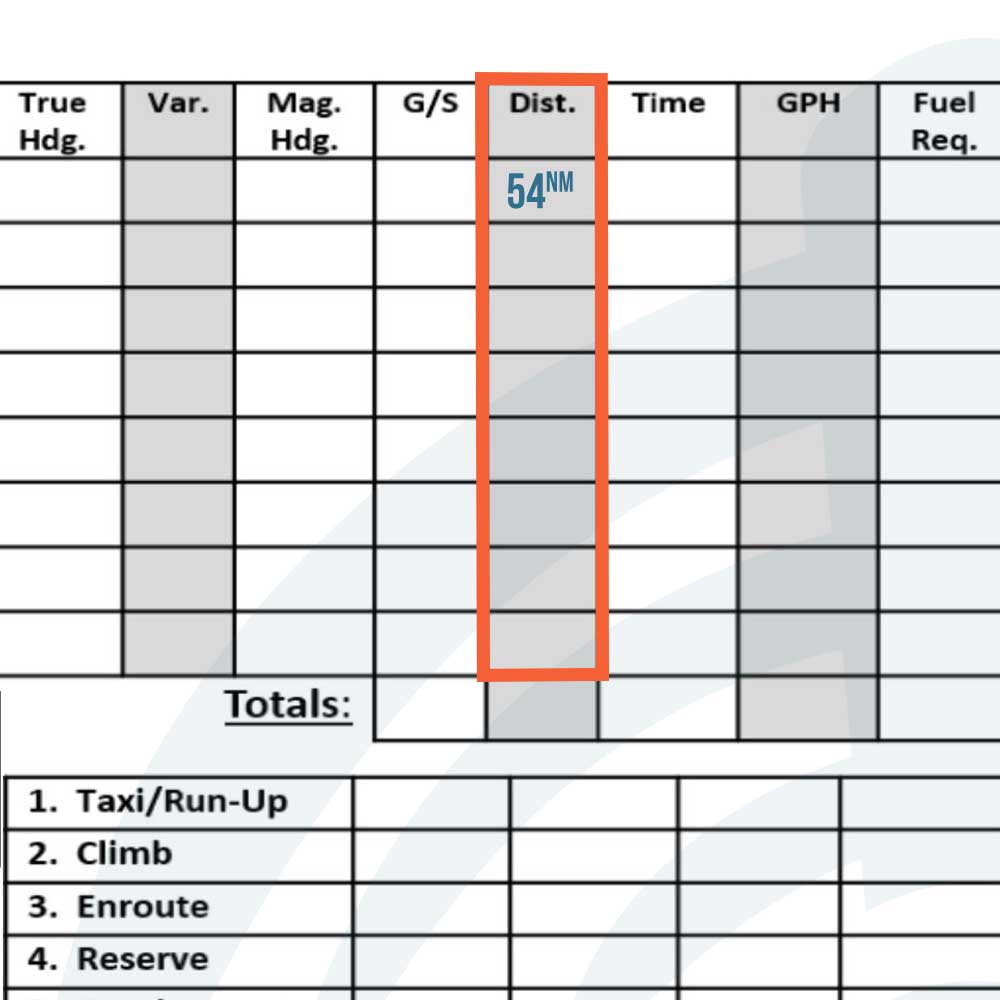
Distance (NM)
Jumping out of order on your VNC Planning chart, measure the line you drew on your VNC Chart with the ICAO Ruler. Be sure to measure with the NM side, not the SM side.
Dist= 54nm
Make checkpoints by marking prominent features, like cities, other airports, power lines, small lakes, and other easy to spot references, on the map. Note the distances between so you can check your groundspeed in flight and revise your ETA. Checkpoints should be roughly 10nm apart. The first one should be at top of climb, after you have time to do your cruise checks, and the last, at top of descent. You can use Google satellite images to see your proposed checkpoints from above and make sure they’ll be fairly easy to spot from the plane.
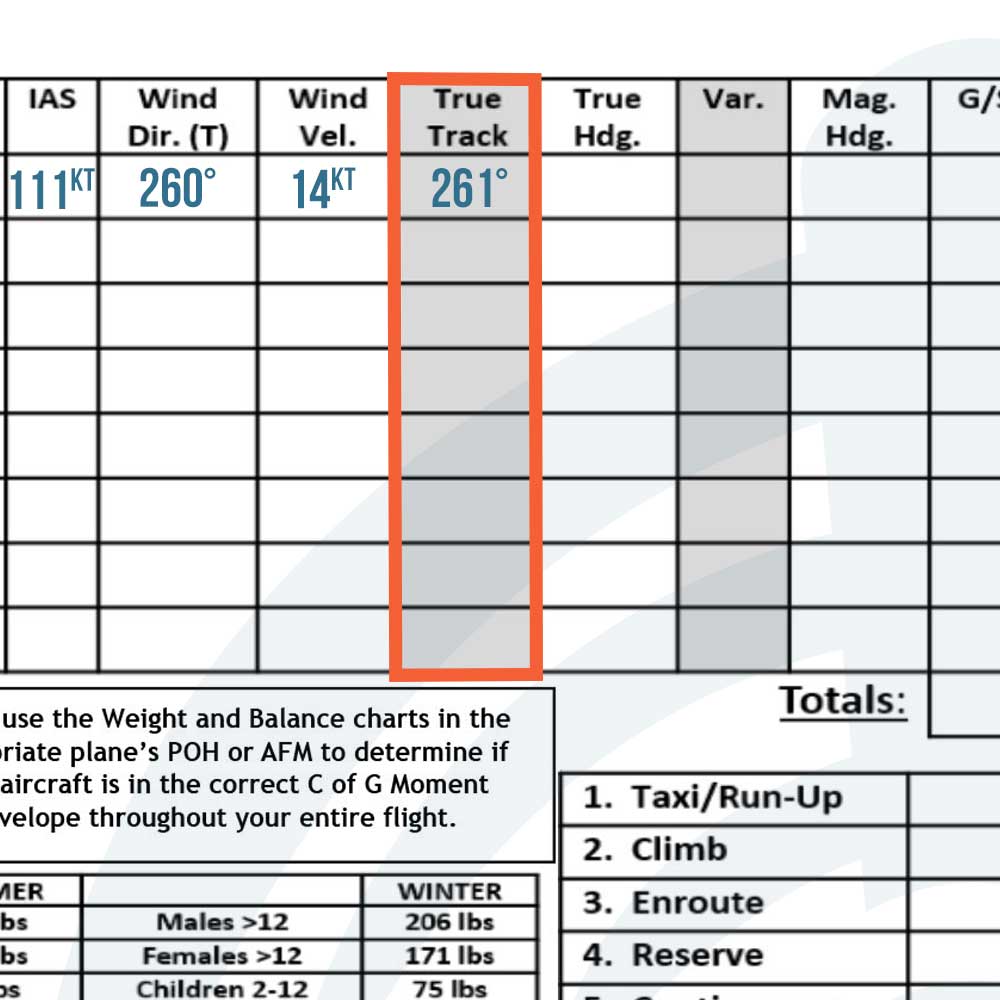
True Track
True track is the intended path to get from YHM to YXU. Use a Douglas Protractor Square Aviation Plotter to measure the angle between your course and true north. Line up the center circle of the protractor anywhere along the route that also allows you to line up a vertical grid line on the protractor, with a vertical grid line on the map. Look along the western edge of the protractor(because we’ll be travelling west) for the True Track direction.
For this route, it’s 261° true.
**If you’re using SkyVector.com for your VNC right now, be sure to click on Nav Log after entering both airports, in order to find the True Track.**
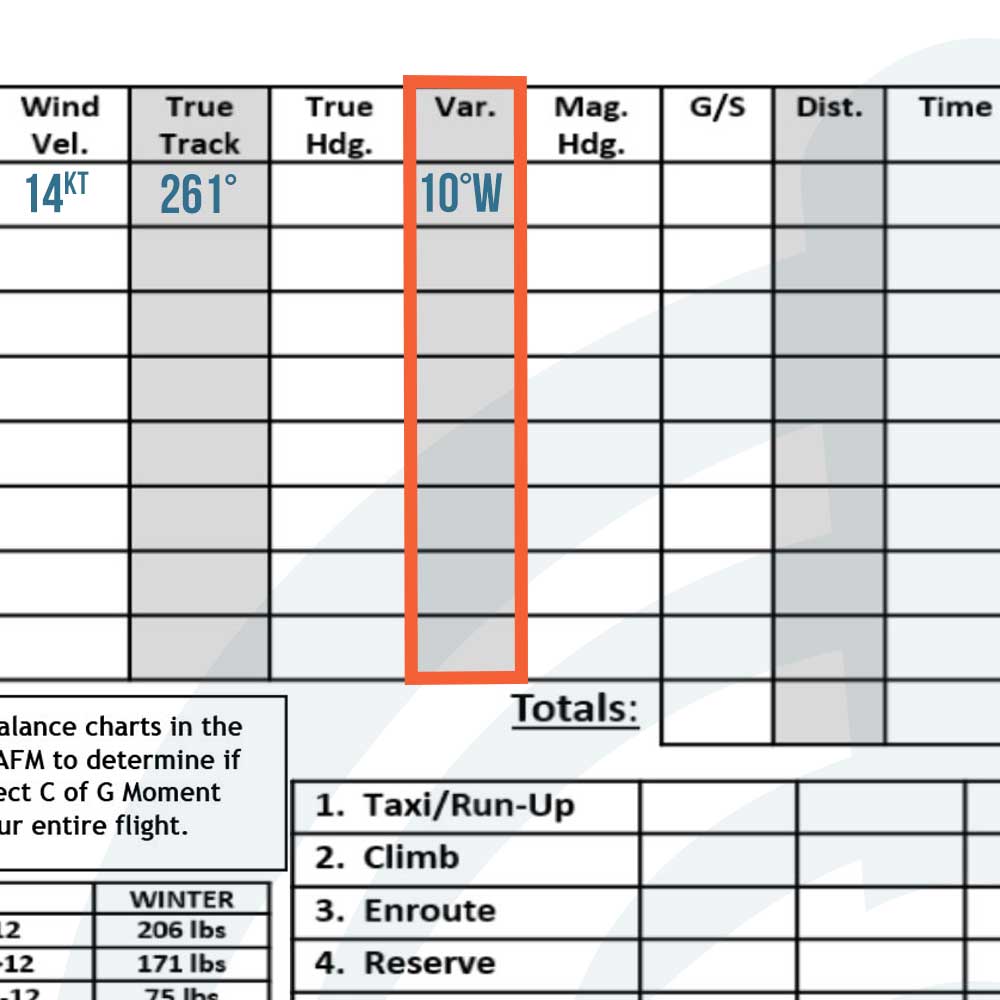
Variation
The angle between true north and magnetic north. Charts are in “true” and based off of true north. Isogonic lines are placed on the chart to help you plan your magnetic heading, which is the heading you fly. To get your magnetic heading, you’ll either subtract the easterly variation from your true track, or add the westerly variation. The saying to help you remember is “east is least (-), west is best (+).”
The CX-3 will calculate this for you but, it’s a good rule to remember.
Isogonic lines are shown in a red/maroon colour on this VNC chart. These lines can be tough to find at first – we’ve put a blue box around 9°W near YXU and 10°W near YHM. The 9°W line actually goes directly through the YXU airport.
We’ll use 10°W for our leg to London.
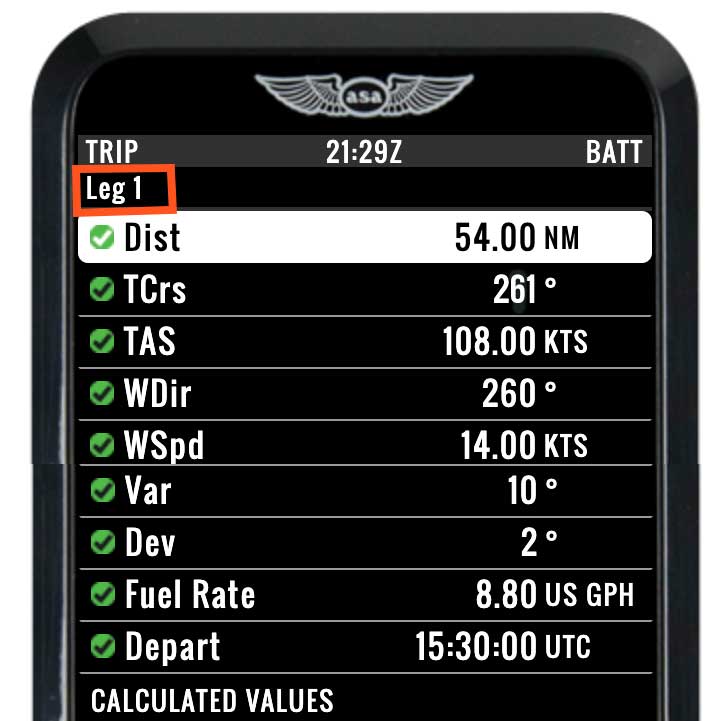
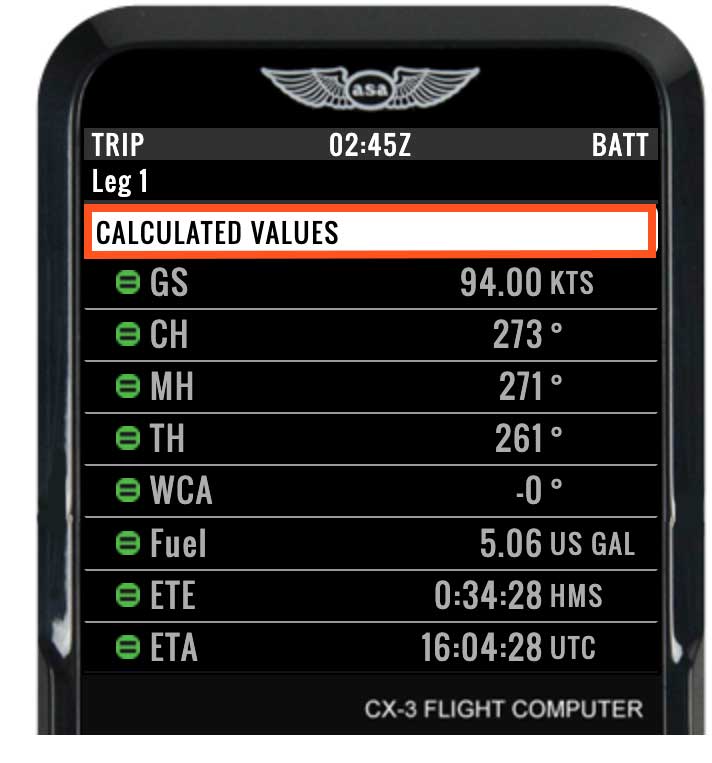
The following sections of our Nav Log will be calculated by filling all numbers we’ve gathered up until now. Use the PLAN button on your CX-3 and “Add Leg 1”. Enter everything up to “Depart”, scroll down, and you’ll find everything filled in under “Calculated Values”.
*Side note: All airplanes have a deviation (Dev) factor and it is to be read off the compass card of the aircraft and either added or subtracted from the magnetic course.
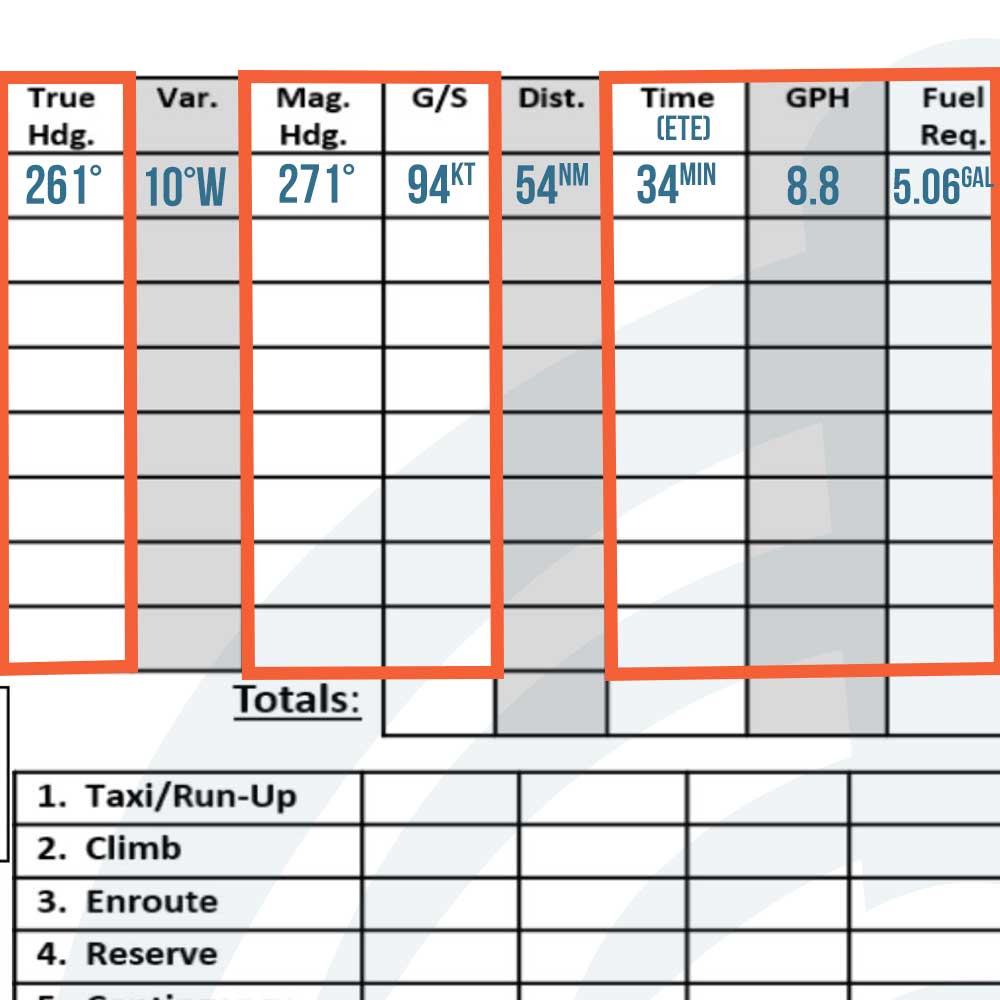
True Heading (TH)
The direction the aircraft is pointed. This compensates for wind drift.
PLAN button > Add Leg 1
TH= 261°
Magnetic Heading
Charts are all in “true” and must be compensated to find magnetic north. “Magnetic” is what we fly. This is the heading you use during flight because we use a magnetic compass to help us navigate.
PLAN > Add Leg 1
MH= 271°
Groundspeed (GS)
PLAN button > Add Leg 1
GS= 94kt
In the air, you can also use the FLT button > Ground Speed option on the CX-3 for any Speed-Time-Distance calculations.
Time (ETE)
PLAN > Add Leg 1
ETE= 34mins
GPH (gallons per hour)
How much fuel the plane will burn through per hour, or the “Fuel Rate.”
Ex: at 65% best power for PA28-161, it uses 8.8gph. Found in POH.
GPH= 8.8
Fuel Required
PLAN button > Add Leg 1
Fuel= 5.06gal
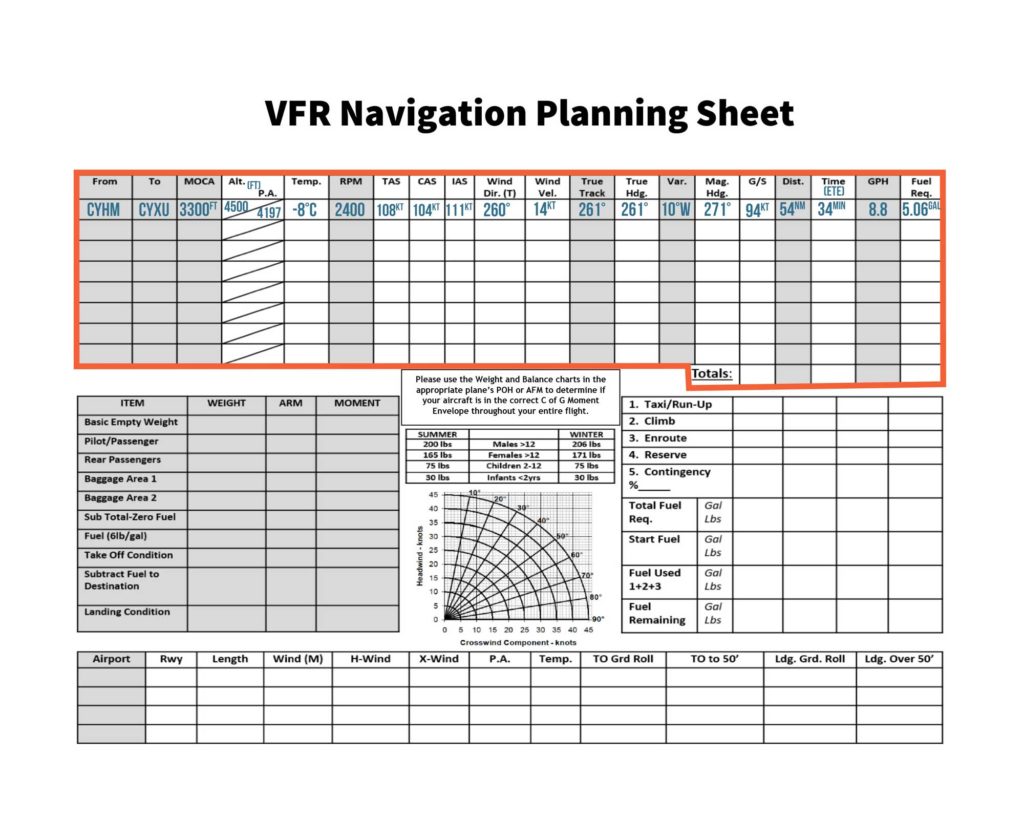
Leg 1
Here is the Nav Log sheet with Leg 1 completely filled in. For practice, you can go ahead and plan Leg 2: CYXU -> CYHM.